- Log in,
- double click on "Civil Engineering";
- double click on "Stella®" (a version number may also be appended);
- double click on "Stella®" (not on Stella Runtime).
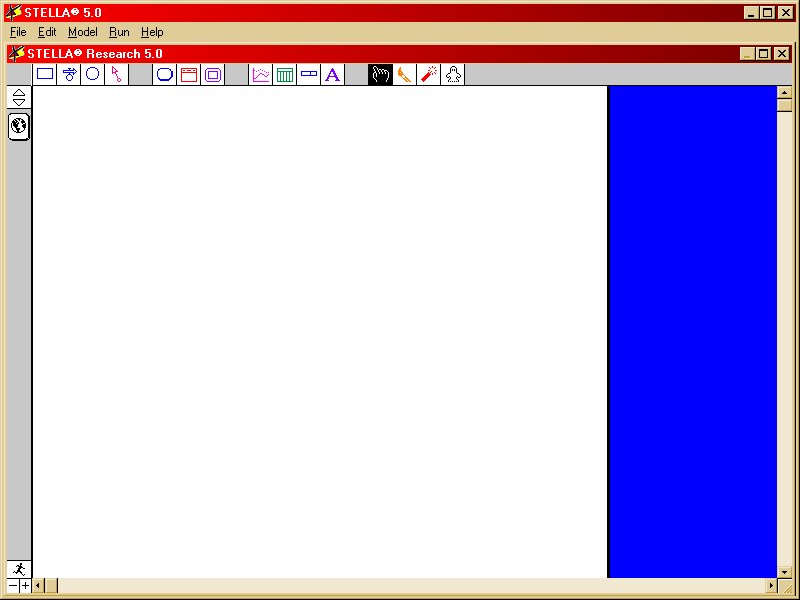
Your start-up screen inside Stella should look something like
this:
[If not, you may need to click on an arrow symbol at the top of
the left side bar.]
On the initial screen, click on the globe icon near the top of
the left side bar.
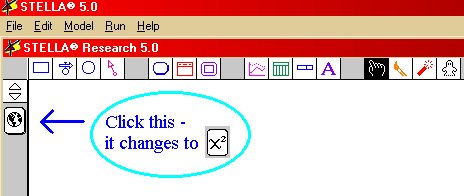
It should change to a chi-square symbol.
Click on the stock symbol
 near the left end of the top toolbar.
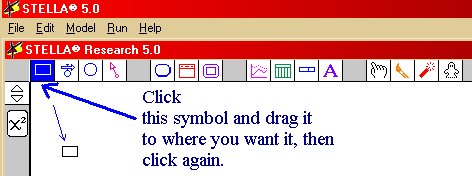
Your cursor changes into the same symbol.
[Note: You do not have to hold the mouse button down
while dragging the newly-shaped cursor to its destination.]
Click again when the cursor is where you wish to place the stock.
The stock appears and your cursor returns to a hand shape.
Note: The “stock taker” represents places in your model where material (water, money, anger, any “stuff”) can accumulate or places from which material can be drained.
Options:
- Click on the "NoName 1" to change the name to something more meaningful, such as "Tank 1".
- Click and hold on the stock symbol to drag it somewhere else on the main window.
- Double click on the stock symbol to set its initial value.
A new window pops up.
The "{Place initial value here ...}" is highlighted.
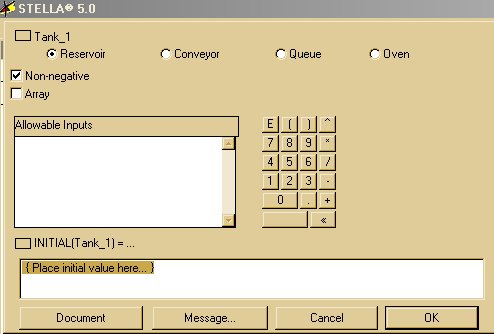
Just type an initial value (such as 100) immediately.
Then click on the "OK" button to close the pop-up window.
The question mark in the centre of the stock item disappears. - If you don’t like this item and wish to remove it entirely,
then click on the red "dynamite" icon
 near the right end of the top toolbar,
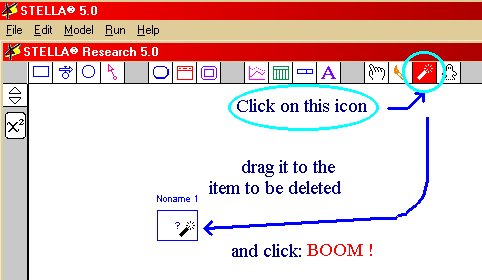
position the cursor over the item to be destroyed and click once.
Create another stock symbol and place it somewhere to the right of
the first one.
Change its name (to something like Tank 2) and set its initial value
(0 is recommended in this example).
Now click on the flow icon
 (next to the stock icon on the top toolbar).
Your cursor changes shape to match the flow icon.
Position your cursor anywhere inside the first stock, then
click and drag towards the other stock until the interior of the
second stock changes colour.
At that point release the cursor.
(next to the stock icon on the top toolbar).
Your cursor changes shape to match the flow icon.
Position your cursor anywhere inside the first stock, then
click and drag towards the other stock until the interior of the
second stock changes colour.
At that point release the cursor.
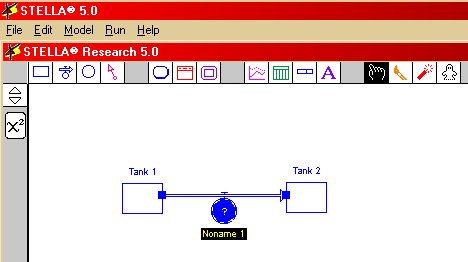
You have now established a flow controller from the first stock to
the second.
You may wish to change the name of the flow controller to something
more meaningful, just as you could for the two stocks.
Note: The flow controller represents a mechanism in your model (such as a pipe and valve) which permits material to flow, usually from one stock to another.
Now click on the converter icon
 (the circle icon next to the flow
controller icon on the top toolbar).
(the circle icon next to the flow
controller icon on the top toolbar).
Your cursor changes shape to match the convertor icon.
Position it somewhere below the other items and click.
Again you can change its name (to something like “Flow Rule 1
to 2” or “Brain”).
Note: The converter is where mathematically stated rules can be defined (be they simple or complex). Such rules are often used to govern flow rates.
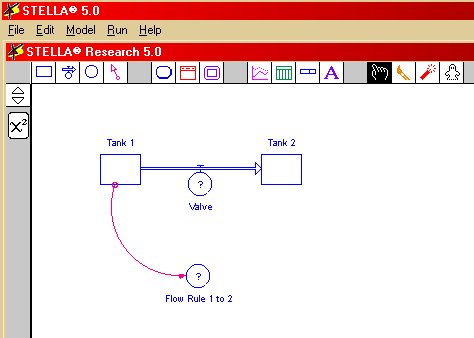
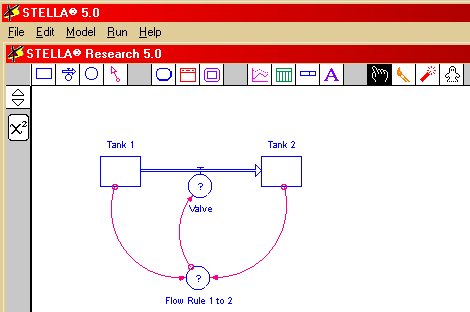
Now click on the connector icon
 (the arrow-shape icon next to
the converter icon on the top toolbar).
(the arrow-shape icon next to
the converter icon on the top toolbar).
Your cursor changes shape to match the connector icon.
Position your cursor anywhere inside the first stock, then
click and drag towards the converter until the interior of the
converter changes colour. At that point release the cursor.
You have now established a flow of information (but not of
material) from the first stock to the converter.
Note: the direction is important for both flows
and connectors.
The connector is used to enable the status of stocks to be sensed
then transmitted to the desired component within the template of
the model. It is also used to convey rules from converters
to flow controllers. A connector cannot run into a stock
taker, only out from it. (The reason is that a connector is
merely a status report about “stuff”.
It is not actually any “stuff” and
therefore cannot fill a box of “stuff”).
Click on the connector icon again, to create another connector, from the second stock to the converter.
Click on the connector icon again, to create another connector,
from the converter to the flow.
When your cursor is in the shape of the hand, you can click on any
item to drag it to a better location. You can vary the
curvature of a connector by dragging its base.
If you wish to move several objects at once, then click the hand on
a blank spot outside any existing icon and drag the rectangle that
appears, until it surrounds all items that you wish to move.
Then click on any one item in the highlighted group.
All selected items will be dragged with it.
With the hand cursor, double click on the convertor.
A new window pops up.
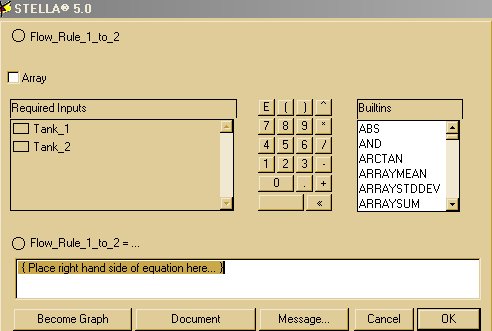
In this window we will set the rule for flow from the
first stock to the second.
For the rule
“flow = (tank1vol - tank2vol)^(0.2)”,
in the new window type "(", then click whatever name
you gave to the first stock (it will be in the "Required
Inputs" box and it will be "Noname 1" if you
haven’t changed it),
then "-", then click on the name you gave to the other
stock, then type ")^0.2", then click on the "OK"
button.
The question mark has now disappeared from the centre of the
converter.
[Note: The rule suggested for this exercise models
an equalization of the two tank levels.
A rule such as
“flow = (tank1vol - tank2vol)/100”
models the draining of one linear reservoir into another.]
Finally, double click on the flow controller.
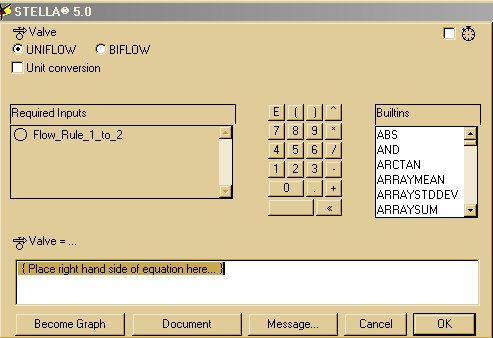
In its pop-up window, just click in the "Required Inputs"
pane on the name that you gave to the converter, then click
"OK".
On the main menu, click on "Model", then
"Model Prefs...".
In the pop-up window, uncheck "Division by Zero Alert"
and click on all three "Animate" shapes (the stock,
flow and connector symbols) so that they are surrounded by
rectangles.
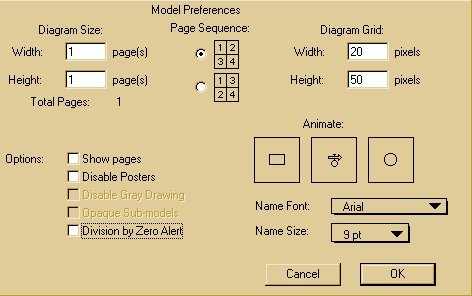
Then click "OK".
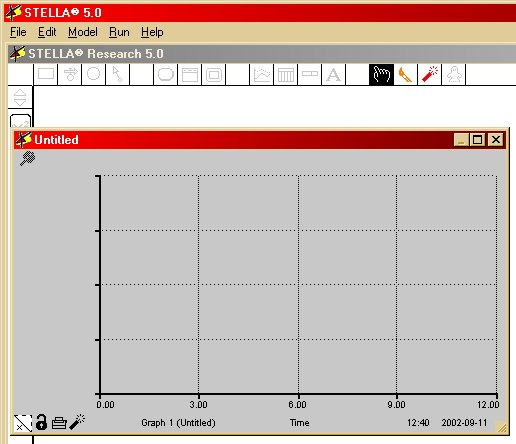
Click on the graph icon
 on the top toolbar.
Move the cursor to any convenient blank place in the main window
and click again.
A graph should appear. (If not, double-click on the graph
icon that you have just placed on the main window.)
Double click on the vertical axis.
In the new window, find the names that you gave to each stock and
double click on each one in turn. They should move over to
the right pane of the window.
Click "OK".
Close the "Untitled" graph window by clicking on its
"X" button at its top right corner.
Now click on the “running man” icon
 at the lower left
corner of the screen. A new small window pops up.
at the lower left
corner of the screen. A new small window pops up.
Click on the down arrow next to "Specs".
Click on "Time Specs...".
In the new window, change the value in the "To" box to 40
and the "DT" value to 0.1.
This should slow the simulation down enough to be viewable on your
screen.
Click on the "OK" button to close this pop-up window.
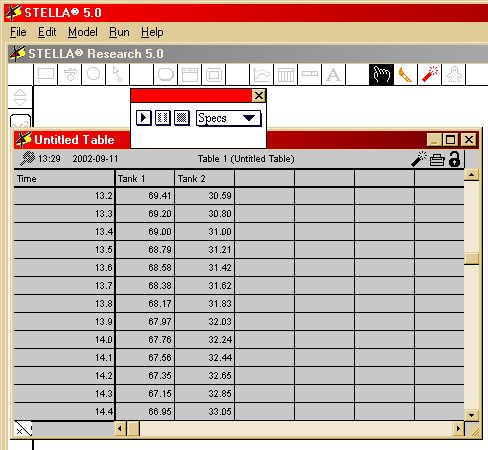
Now you’re ready to run the simulation.
In the small window,
click on the right arrow button
 and see what happens!
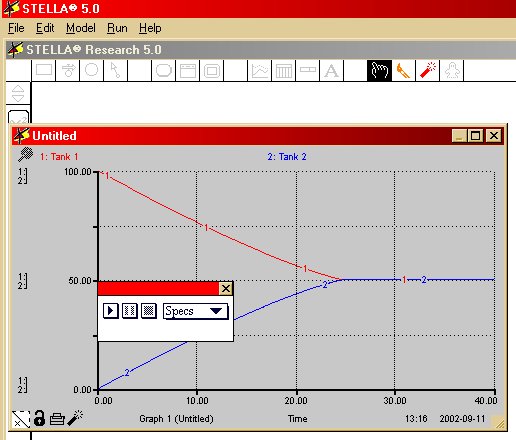
Double click on the graph to open it, then watch the graph being generated during your next run.
You may have noticed a cardinal sin of graphing being committed:
there are different scales for the two ordinates on the same
axis! In order to correct this fault, open the graph, double
click on the vertical axis, click on the name of your first stock
in the "Selected" pane, then click the double arrow symbol
 to its right so that bars appear above and below it
 ,
then type new values for minimum and maximum values (0 and 100 in
this example) in the boxes provided, then click the "Set"
button and click the "OK" button.
,
then type new values for minimum and maximum values (0 and 100 in
this example) in the boxes provided, then click the "Set"
button and click the "OK" button.
Repeat this process for the other stock taker.
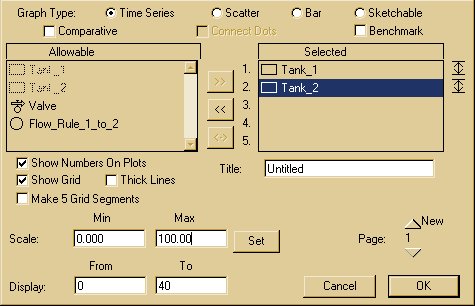
Then run your simulation again.
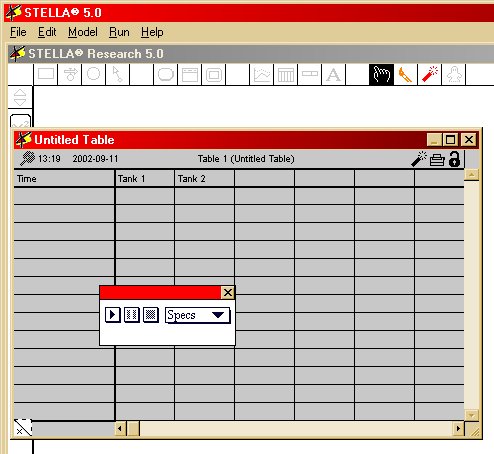
You can also generate a table of values associated with your
graph.
Click on the table icon
 on the top toolbar.
Move the cursor to any convenient blank place in the main window
and click again.
A table (like a spreadsheet) should appear. (If not, double-click on the table
icon that you have just placed on the main window.)
Double click on the head of the first blank column (which
should be column #2).
In the pop-up window, double-click on the name that you gave to
your first stock, to move it from the left "Allowable"
pane to the right "Selected" pane,
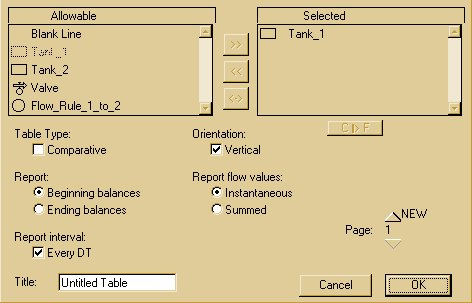
then click "OK" to close that window.
That name should now appear at the head of column 2.
Double click on the head of the next blank column (which
should be column #3).
In the pop-up window double-click on the name that you gave to
your second stock,
then click "OK" to close that window.
That name should now appear at the head of column 3.
During your next run, you can watch the values being generated
in your table.
Finally, save your session and exit.
