ENGI 3423 - Probability Simulation using MINITAB
In this session we shall use Minitab® to
Also provided on this web page are
Creation of a Macro File
Copy the following block of text and paste it into a blank
document in a word processor (even Notepad will suffice).
It is also available as a separate file at
this link, (with a file name
"Coins.txt" instead of "Coins.mac",
because programs such as QuickTime insist on hijacking the
".mac" extension for image files instead of plain
text Minitab macros).
gmacro
Coins
### Simulation to illustrate the evolution of the relative frequency of
### heads as a fair coin is tossed many times.   The relative frequency
### estimates the exact probability of 1/2 .
### Execute this macro in a blank Minitab project.
### Macro created 2003 03 14 and last modified 2006 09 16 by G.H. George

  erase c1-c3           # needed to ensure clear space in the worksheet
### Constants:
### k1 = coin index number (loop counter)
let k2 = 1500           # number of coins
let k3 = 0              # accumulator = number of heads in the first k1 coins

### Columns:
  name c1 'trial'       # number of coin tosses so far
  name c2 'head?'       # = 1 if this coin is a head, = 0 if a tail
  name c3 'Rel.Freq.'   # proportion of heads so far

### Place the first (k2) natural numbers into column c1:
  set c1
    1:k2
    end.
### assign 0 (tail), 1 (head) randomly to the k2 coins:
  random k2 c2;
    integer 0 1.
### toss the coin k2 times, recording number & proportion of heads so far:
  do k1=1:k2
      let k3 = k3 + c2(k1)
      let c3(k1)=k3/k1
  enddo

  let k1 = c3(k2)
  note The last estimated probability of a head is
  print k1
  note Compare this with the true probability of 0.500000
### Plot the relative frequency as a time series plot:
Tsplot 'Rel.Freq.';
  Scale 2;
    MODEL 1;
      Tick 0.3 0.35 0.4 0.45 0.5 0.55 0.6 0.65 0.7;
      Min 0.3;
      Max 0.7;
    EndMODEL;
  AxLabel 1;
    ADisplay 1;
    Label "# coins";
      ALevel 1;
  Index;
  Connect;
  Symbol;
    Type 0;
    Size 0.7;
  Grid 2;
  Title "ENGI 3423 Empirical Probability";
  SubTitle "Coin Tossing Experiment";
  Footnote;
    FPanel;
  NoDTitle.

endmacro
If you are using the computers in EN 3000/3029, then save the
file on your account (as "m:/Coins.mac")
or on a floppy disk (as "a:/Coins.mac").
If you have a copy of Minitab on your own computer, then save the
file in your Minitab Macros directory, (on some computers,
it is at
"C:/Program Files/MINITAB 14/Macros/"),
with the name "Coins.mac".
A note about file extensions:
By default, Windows / Notepad insists on appending a hidden
extension ".txt" to the name of
your newly-created macro file.
However, Minitab recognizes only files whose names end with
".mac" to be macro files.
To escape from this problem,
- in Windows 95 and 98:
open Windows Explorer,
go to the directory where your file is located,
click on the item "View" in the
menu bar at the top, click on the last item in the drop
down menu, "Options..." and, in
the new menu, ensure that the option "Hide
extensions" is not
checked. Click "Apply"
then "OK".
- in Windows XP:
open Windows Explorer,
go to the directory where your file is located,
click on the item "Tools" in the
menu bar at the top, click on the last item in the drop
down menu, "Folder Options...",
click on the "View" tab and, in
the new pane, ensure that the option "Hide
extensions for known file types" is
not checked.
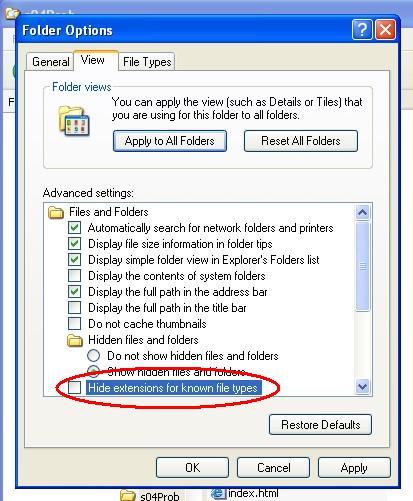
Click "Apply"
then "OK".
Now inspect the name of your file.
If it ends in ".txt", then
right-click on the file name and rename it to
"Coins.mac".
The main alternative is to enclose the macro’s filename
in double quotes in the "File name" field
of the "Save As" dialog box,
every time that you wish to save a macro file.
Some Notes on Macro Syntax
The first two lines of most Minitab global macros are
    gmacro
    macroName
and the last line is
endmacro
The line indentation and blank lines are not required.
However, as is the case with any type of computer program,
a macro is much easier to read if these style conventions are
employed.
The comment symbol ("//" in C++ and
"'" in Visual Basic) is the hash mark
# in a Minitab macro.
All text following # in a line is ignored by
Minitab, (even inside an input prompt or output string).
If you want other readers to know how your macro
achieves its objectives, then make good use of comments.
To give a name to a column, use the structure
name cn 'NameOfColumn'
where n is the number of the column in the
worksheet in the Data window.
Before naming a column or entering data into it, check if your
algorithm requires any existing data to be cleared first.
That will be the case here, if the same macro is called a second
time inside the same project.
The command to clear a range of columns is
erase cm-cn
To output a literal string, use the keyword
note.
On a line that starts with note, all text following
on that line, (up to the first #, if any), will
appear in the Session window exactly as is.
To print the values of constants in the session window, use
print kn
Columns appear automatically in the spreadsheet in the Data window.
The principle loop structure (essentially a FOR-NEXT loop
with unit step size) is
    do k1=k2:k3
        statements
    enddo
Input
This macro needs no input at all from the user.
If you do wish your macro to accept input, then
input from the keyboard uses the structure
    set cn;

        file "terminal";

        nobs 1.
The semicolon ";" indicates that the Minitab
command is not complete and continues with subcommands on the next line,
while the period "." closes the command.
In principle, more than one datum can be input in the same keyboard
response, (separated by a space). In that case the number of
data replaces the "1" in "nobs 1.".
However, it is usually safer to ask the user to input the data
one item at a time and to use the note method to
prompt the user.
Also note how data may be entered directly from the keyboard only
into a worksheet column, not into a constant. Input data may
be copied into a constant using the structure
copy cm kn
where m and n are positive integers.
Time Series Plot
The lengthy block of command and subcommands
### Plot the relative frequency as a time series plot:
Tsplot 'Rel.Freq.';
  Scale 2;
    MODEL 1;
      Tick 0.3 0.35 0.4 0.45 0.5 0.55 0.6 0.65 0.7;
      Min 0.3;
      Max 0.7;
    EndMODEL;
  AxLabel 1;
    ADisplay 1;
    Label "# coins";
      ALevel 1;
  Index;
  Connect;
  Symbol;
    Type 0;
    Size 0.7;
  Grid 2;
  Title "ENGI 3423 Empirical Probability";
  SubTitle "Coin Tossing Experiment";
  Footnote;
    FPanel;
  NoDTitle.
produces a time series plot similar to this
![[time series plot of empirical probability]](i26plot.jpg)
The subcommands were not generated directly.
Instead, the graphical interface of Minitab 14 was used, as illustrated
in this separate web page, to generate
a plot from data placed in column c3 (named
'Rel.Freq.') by the preceding part of the macro.
Execution of the Macro File
Start Minitab.
![[screenshot]](i21editorcomm.jpg) |
|
Click anywhere in the Session window.
On the main menu bar, click on "Editor".
If "Enable Commands" is not checked,
then click on it.
This step is necessary in order to
enter data from the keyboard
directly into the Session window. |
The Minitab prompt then
appears in the Session window. |
|
![[screenshot]](i22mtbprompt.jpg) |
![[screenshot]](i23invoke.jpg) |
|
In the Session window type
"%m:/Coins"
(or "a:/Coins"
or the other drive, path and name you have given to your macro,
immediately after the "%" symbol)
and press the "Enter" key.
[By default, Minitab searches for macros in its own directory
on the c: drive.]
|
The results now appear.
They will usually be slightly different with each run.
![[screenshot]](i24session.jpg)
![[screenshot]](i25data.jpg)
You can copy and paste the above results into your Report Pad.
Then save your work and exit.
For more practice,
follow the link below to find another example
of the simulation of empirical probability using Minitab.
The next example is the famous “birthday problem”:
If n randomly chosen people are in a room, then what is the
probability that at least two of them will share the same birthday?
 [Return to the index of
demonstration files]
[Next Example]
[Return to the index of
demonstration files]
[Next Example]

[Return to your previous page]
Created 2003 03 26 and most recently modified 2007 07 09 by
Dr. G.H. George