Faculty of Engineering and Applied Science
2007 Fall
From a box of seven identical valves, three valves are to be selected; one to be placed in an intake pipe, one in an outflow pipe and one in a drainage pipe. In how many different ways can these three valves be chosen?
[10]
From prior experience, it is believed that the mean
potential of a certain type of battery is 12.0 V.
The strength of this belief is represented by the standard
deviation .
A random sample of 81 such batteries has a sample mean
potential of 12.2 V with a sample standard deviation of
0.3 V.
[8]
[5]
[2]
The diameter of a cylinder is known to be a normally
distributed random quantity with a mean
and a standard deviation
The diameter of a piston is known to be a normally distributed
random quantity with a mean
and a standard deviation
.
[8]
[7]
Four components are assembled into a system as shown.
A signal can flow through a subsystem connected in parallel
(such as A-B) if at least one of the two components
is working.
A signal can flow through a subsystem connected in series only
if both of its components are working. The probability
that a component is working is
[15]
The heat output of 20 randomly selected motors performing certain tasks is measured. A new ventilation system is installed on those 20 motors and the heat output is measured again. An agent claims that the new ventilation system increases the heat output. It is known that both populations are normally distributed.
[3]
Paired T for New - Old N Mean StDev SE Mean New 20 167.24 22.06 4.93 Old 20 157.18 24.67 5.52 Difference 20 10.06 10.80 2.41 99% lower bound for mean difference: 3.93 T-Test of mean difference = 0 (vs > 0): T-Value = 4.17 P-Value = 0.000
Two-sample T for New vs Old N Mean StDev SE Mean New 20 167.24 22.06 4.93 Old 20 157.18 24.67 5.52 Difference = mu (New) - mu (Old) Estimate for difference: 10.06 99% lower bound for difference: -7.91 T-Test of difference = 0 (vs >): T-Value = 1.36 P-Value = 0.091 DF = 38 Both use Pooled StDev = 23.4053
[10]
[2]
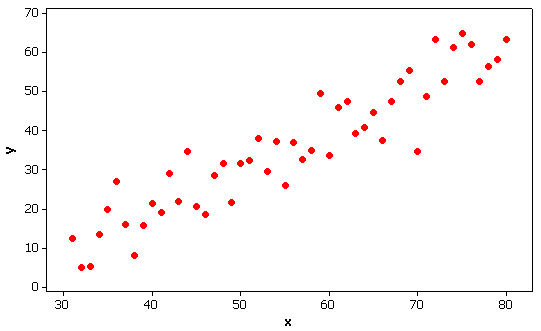
A random sample of fifty test objects is measured before
(x) and after (y) a recalibration of the
measuring device. A plot of the observed values of
Minitab® produces the regression equation
Source DF SS MS F P Regression 1 11545 11545 309.40 0.000 Residual Error 48 1791 37 Total 49 13336
A transmitter sends only two types of signal, 'A' and 'B'. In any one transmission, exactly one of these signals is sent, with signal 'A' being twice as likely as signal 'B'. After passage through a relay system, one of three signals, 'X', 'Y' or 'Z' is received. The following conditional probabilities are known:
[4]
Find which of signals 'A', 'B' is more likely, if signal 'Y' is received.
[4]
Find which of signals 'A', 'B' is more likely, if signal 'Z' is received.
[3]
Hence find the probability that this system correctly determines which of signals 'A', 'B' was transmitted.
[4]
BONUS QUESTION:
A random sample of 1000 people is taken, in order to determine whether or not a majority of the population would answer “yes” to a certain question.
Given that the true population proportion of the population
that would answer “yes” to the question is 55%,
find the probability (correct to two significant figures) that
the random sample would lead to the appropriate hypothesis
test (at a level of significance of
[+6]
[Also provided with this examination paper were tables of the
standard normal c.d.f. (the
z tables)
and of the critical values of the t distribution
(the t tables).]