Quasar Alignments - Derivation of Expectation
What follows is based on section 5.2 of the Ph.D. thesis
“The Alignment and Clustering of Quasars”,
by Glyn George (1983).
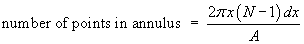
Having taken one point as the pivot and another as the far
end of the alignment, there are (N – 2)
quasars remaining in the field, each of which has an equal
chance of falling in the acceptance zone.
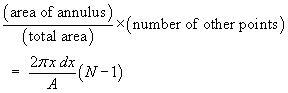
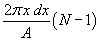
Hence, in each acceptance zone, we expect to find, on average,
a number of points given by
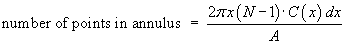
We expect the number of alignments of “tolerance”
p < pmax and of span
d ∈ (x, x + dx)
around a given point to be
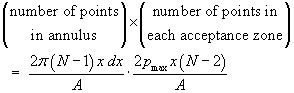
Integrating over all values of the alignment span d
up to dmax, we obtain the number of
alignments expected around each point to be
Now we take each quasar in turn as the pivotal quasar
and sum the expectations. However, each distinct
alignment will be counted twice: once with the
quasar at one end as the pivot, then again with the
quasar at the other end as the pivot. We must
therefore divide this sum by 2 in order to give the
total number of alignments of distinct triples of
points expected, E[nP], in a field
with periodic boundaries:
![E[nP] = (2pi/3)(pmax*dmax^3 / A^2)
*N(N-1)(N-2)](align08.gif)
For a square area of side L, this can be rewritten as
![E[nP] = (2pi/3)*N(N-1)(N-2)*(pmax/L)(dmax/L)^3](align09.gif)
Boundary Correction
Let us now determine the boundary correction for the
L×L square, for which we assume
dmax < L / 2 .
![[square with border zones identified]](align11.gif)
|
The square divides into three obvious regions,
(centre, edges and corners), whose extent varies
with the alignment span x.
Elementary search annuli whose centres fall in
region (1) will lie entirely within the square
and will be unaffected by edge effects.
That is,
C1 = 1 and
A1 =
(L – 2x)2,
where Ai = the area of
region (i) and
Ci = the edge-effects
correction factor for region (i).
|
|
In region (2), one of the four edges will cause some
of the search area to be lost, as shown here.
s is the distance from the centre of the
search annulus to the nearest edge of the square and
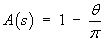
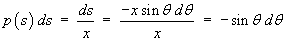
x is the inner radius of the annulus.
Let A(s) be the proportion of the search
area remaining inside the field. Then, using the
notation in this figure,
s = x cos θ
Recalling that the search area is an elementary
annulus, we have
The probability of finding a randomly placed point in
the range (s, s + ds),
given that it is somewhere in (0, x),
is
|
![[partial loss of search area over an edge of the square]](align12.gif) |
For a given span x, the mean proportion of area
remaining in a search area placed at random in region (2)
is
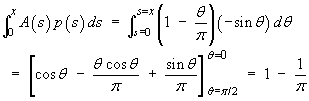
Therefore, in region (2),
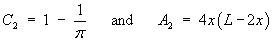
|
In region (3), part of the elementary search area will be
lost over two of the four edges.
s is the distance from the centre of the
search annulus to the nearer vertical edge of the square,
t is the distance from the centre of the
search annulus to the nearer horizontal edge of the square and
x is the inner radius of the annulus.
Let A(s, t) be the proportion
of the search area remaining inside the field.
Then, using the notation in this figure,
s = x cos θ
and
t = x cos φ ,
which leads to

|
![[partial loss of search area
over two edges of the square
at a corner]](align13.gif) |
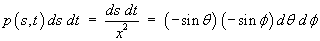
The probability of finding a randomly placed point in the
range s < X < s + ds ,
t < Y < t + dt ,
given that the point is somewhere in the range
0 < X, Y < x , is
For a given span x, the mean proportion of area
remaining in a search area placed at random in region (3)
is
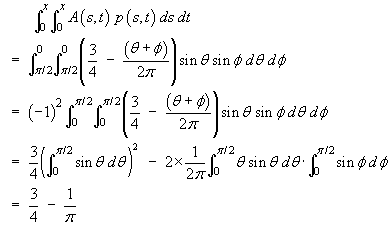
Therefore, in region (3),
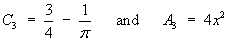
Bringing the correction factors for the three regions together,
we arrive at the overall correction factor
C(x)
for edge effects on an alignment of span x:
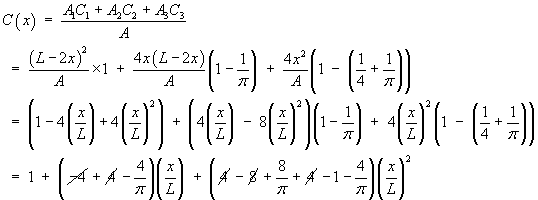
Therefore
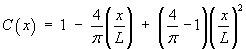
At the start of the derivation of E[nP],
we replace
by
With this amendment, we proceed as before, to obtain
![[Integral expression for E[nF],
incorporating C(x) ]](align26.gif)
Therefore
![E[nF] = E[nP] * (1 - (3/pi)(d/L) + (3/5)(4/pi - 1)(d/L)^2)](align27.gif)
For the standard 5°×5° field in the thesis,
with L = 5°,
dmax = 1° and
pmax = 30" ,
we have
![E[nP] = pi*N(N-1)(N-2)/112500](align10.gif)
and
E[nF] =
0.8156 × E[nP] =
2.2775×10⁻⁵ N
(N – 1) (N – 2)
In the thesis, these expressions were verified by Monte-Carlo
simulations and by comparison with the few published works
available at that time.
 [Return to thesis summary]
[Return to your previous page]
Created 2003 08 02 and most recently modified 2003 08 03 by
Dr. G.H. George
![[annulus of thickness dx around a point]](align01.gif)
 other quasars, in turn, will form the other end
of a candidate alignment of length x.
If an intermediate quasar falls within a distance
pmax of the line joining the
first two quasars, then it is in the acceptance
zone shown here and the candidate alignment will
be accepted.
other quasars, in turn, will form the other end
of a candidate alignment of length x.
If an intermediate quasar falls within a distance
pmax of the line joining the
first two quasars, then it is in the acceptance
zone shown here and the candidate alignment will
be accepted.![[acceptance rectangle defined by two points]](align02.gif)