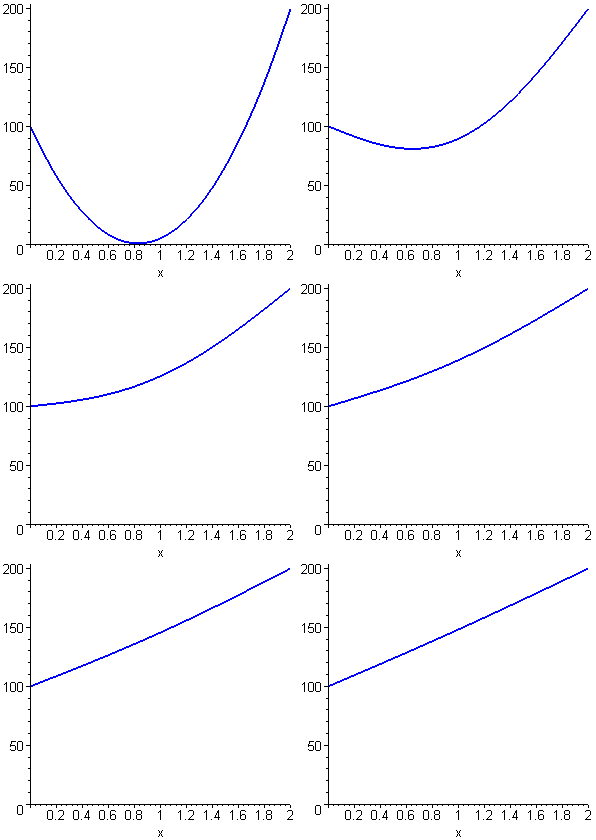
As noted on page 8.37 of the lecture notes, the complete solution
is

The Maple session below produces this
animation:

ex8061.mws
| > | # G.H. George ENGI 9420 2007 07 17 updated 2012 11 20 |
# 2012 Fall Example 8.06.1.
# Animation of the temperature distribution satisfying the heat equation du/dt = 9 * d2u/dx2
# with the initial temperature distribution  (0 < x < 2).
# The left end of the bar (at x = 0) is kept at 100 C.
# The right end of the bar (at x = 2) is kept at 200 C.
| > | v(n,x,t) := 2320/(n*Pi)^3 * ((-1)^n - 1) * sin(n*Pi*x/2)
* exp(-(3*n*Pi/2)^2 * t); |

| > | u(x,t) := sum(v(n,x,t),n=1..10)
+ 50*x + 100; |


| > | animate(u(x,t), x=0..2, t=0..0.2, frames=50, color=blue,
thickness=2); |
![[Maple Plot]](im/ex80615.gif)
| > | # click the right mouse button on the diagram above |
| > | # select "Animation" and select "Play". |
| > | f(x) := sum(u(x,t),t=0..0); |

| > | plot(f(x), x=0..2, f=-50..200, color=blue, thickness=2,
title=`t = 0.000`); |
![[Maple Plot]](im/ex80617.gif)
| > | f(x) := eval(u(x,t),t=0.001); |


| > | plot(f(x), x=0..2, f=-50..200, color=blue, thickness=2,
title=`t = 0.001`); |
![[Maple Plot]](im/ex806111.gif)
| > | f(x) := eval(u(x,t),t=0.010); |


| > | plot(f(x), x=0..2, f=-50..200, color=blue, thickness=2,
title=`t = 0.010`); |
![[Maple Plot]](im/ex806115.gif)
| > | f(x) := eval(u(x,t),t=0.050); |


| > | plot(f(x), x=0..2, f=-50..200, color=blue, thickness=2,
title=`t = 0.050`); |
![[Maple Plot]](im/ex806119.gif)
| > | f(x) := eval(u(x,t),t=0.100); |


| > | plot(f(x), x=0..2, f=-50..200, color=blue, thickness=2,
title=`t = 0.100`); |
![[Maple Plot]](im/ex806123.gif)
![]()


 (0 < x < 2).


![[Maple Plot]](im/ex80617.gif)


![[Maple Plot]](im/ex806111.gif)


![[Maple Plot]](im/ex806115.gif)


![[Maple Plot]](im/ex806119.gif)


![[Maple Plot]](im/ex806123.gif)